
Accessibility – the ease of reaching valued opportunities such as jobs, workers and shops – is the whole reason cities exist. There is no reason to locate anywhere but to be near things, far from things, or to possess things. Access measures this.
Locations with better accessibility to urban opportunities generally have higher development density and more expensive real estate. This is because places with higher accessibility are more productive, so their workers earn higher wages. And modes of transport that reach more opportunities – that is, provide access to places where people work, live, shop, and more – tend to have higher market share.
Read more: Growing cities face challenges of keeping the masses moving up, down and across
Our new report, Access Across Australia, for the first time generates a set of consistent maps and graphs of 30-minute access to jobs and workers by each transport mode for each of the eight capital cities. This covers around 70% of the nation’s resident workers and employment opportunities.
The full report compares 10-minute to 60-minute accessibility to both employment locations and to workers’ homes by four modes of transport – car, public transport, walking, and cycling – for each city. It also reports the overall job-worker balance, comparing how many workplaces can be reached to how many competing workers want to reach those same workplaces.
The accessibility measures take into account the effects on travel times of traffic congestion and the walking and transfer elements of the public transport mode.
Accessibility captures the combined effect of land use and transport infrastructure. The faster and more direct the network, the higher the access. The more opportunities (people and places) that can be reached, the higher the accessibility.
This value varies across and between regions. For this article, we show this in maps for Sydney – the full report has maps for all four transport modes, for both jobs and labour (resident workers), for all eight cities. In the table, city-level accessibility numbers are reported as a metropolitan average, weighted by the number of people who experience that accessibility (population-weighted accessibility), to best represent the experience of the working population.
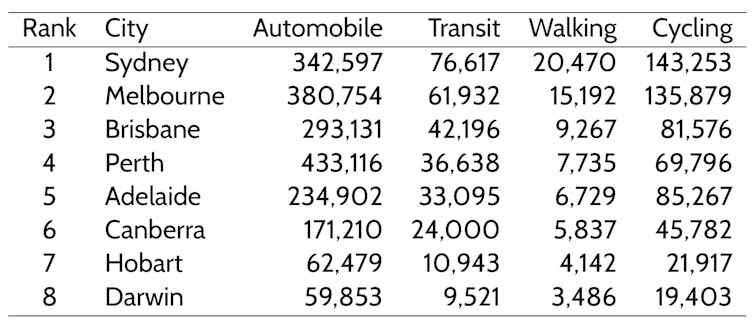
Population-weighted 30-minute accessibility to jobs; cities ranked by the size of employment opportunities. Hao Wu and David Levinson